Entering a Lucrative Market
Search Engine Optimisation Case Study
+143%
YoY Organic Conversions
+82.7%
YoY Organic Sessions
+29.4%
Organic Conversions
The Brief
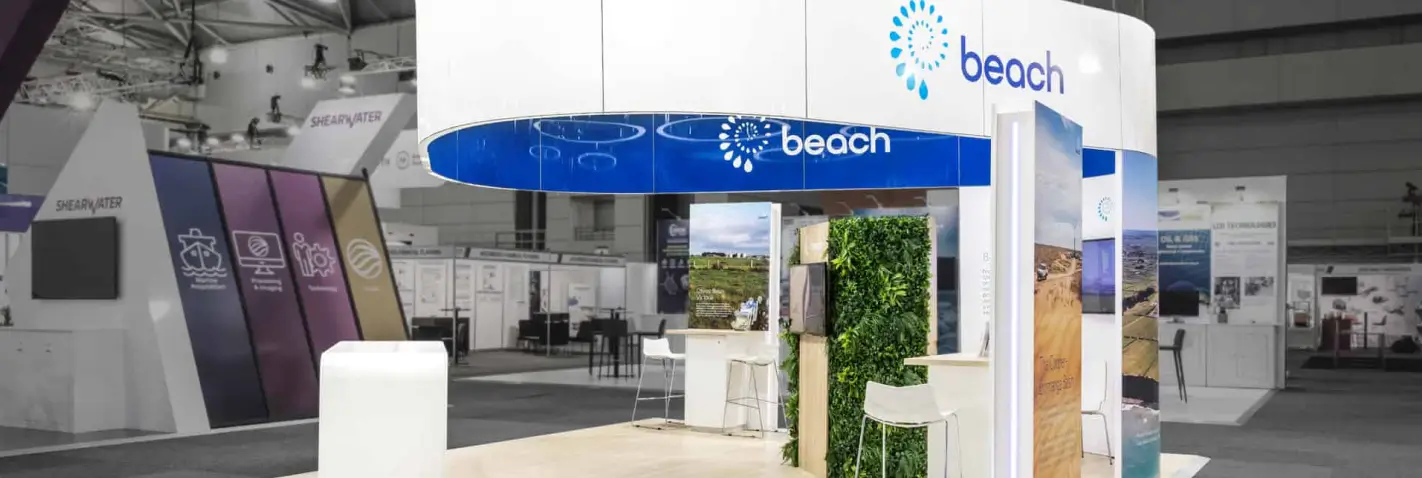
Expocentric is Australia’s premier exhibition stand company, intent on dominating the search engines and driving high six-figure prospects through their website. With a hugely ambitious owner, our task was to devise and execute a strategy to make this happen. All of our work was held accountable to sales, nothing else.
The Solution
The solution was to research and plan a new service architecture, ensuring all service offerings had a dedicated page with content that was written to outperform the competition on Google, as well as to represent the brand tone of voice and accurately convey the depth of expertise that Expocentric pride themselves on.
Post-launch of the architecture, we provided SEO-targeted content strategies to support their core business pillars, and a supporting link building campaign.
The Result
Organic Traffic
- Sessions
- Sessions (previous year)
| Aug 2022 | 715 | |
|---|---|---|
| Sept 2022 | 494 | |
| Oct 2022 | 937 | |
| Nov 2022 | 903 | |
| Dec 2022 | 770 | |
| Jan 2023 | 1.3K | |
| Feb 2023 | 1.6K | |
| March 2023 | 1.8K | |
| April 2023 | 1.4K | |
| May 2023 | 1.5K | 763 |
| June 2023 | 1.4K | 1.1K |
| Jul 2023 | 1.6K | 846 |
In less than a year we managed to more than double organic traffic to the website. This is a trend that will continue as the benefits of our work compound over time.
Organic Conversions
- Conversions
- Conversions (previous year)
| Aug 2022 | 9 | |
|---|---|---|
| Sept 2022 | 7 | |
| Oct 2022 | 16 | |
| Nov 2022 | 10 | |
| Dec 2022 | 12 | |
| Jan 2023 | 10 | |
| Feb 2023 | 20 | |
| March 2023 | 21 | |
| April 2023 | 12 | |
| May 2023 | 22 | 8 |
| June 2023 | 16 | 20 |
| Jul 2023 | 34 | 14 |
All that matters to the client is leads and sales. SEO has the power to build a website’s lead funnel on a regular consistent basis.
Non-Branded Impressions
- Non-Branded Impressions
- Non-Branded Impressions (previous year)
| Aug 2022 | 26.8K | |
|---|---|---|
| Sept 2022 | 29.9K | |
| Oct 2022 | 45.3K | |
| Nov 2022 | 55.5K | |
| Dec 2022 | 67.5K | |
| Jan 2023 | 84.8K | |
| Feb 2023 | 83.4K | |
| March 2023 | 81.7K | |
| April 2023 | 66.5K | 21.2K |
| May 2023 | 69.5K | 26.7K |
| June 2023 | 68.4K | 24.7K |
| Jul 2023 | 79.2K | 26.2K |
Non-branded impressions are the amount of times that our client’s search engine results have been found by users of Google who use keywords that don’t contain the company’s name. In essence, potential customers who don’t know that the client already exists. The client’s non-branded visibility on Google has been increasing steadily since the beginning of the campaign, an increase of 202.3% for the month of July.
Non-Branded Clicks
- Non-Branded Impressions
- Non-Branded Impressions (previous year)
| Aug 2022 | 81 | |
|---|---|---|
| Sept 2022 | 59 | |
| Oct 2022 | 87 | |
| Nov 2022 | 97 | |
| Dec 2022 | 120 | |
| Jan 2023 | 165 | |
| Feb 2023 | 206 | |
| March 2023 | 190 | |
| April 2023 | 186 | 42 |
| May 2023 | 212 | 69 |
| June 2023 | 161 | 61 |
| Jul 2023 | 169 | 62 |
The increase in non-branded clicks is due to the combination of our commercial site architecture work plus a targeted informational content strategy. Essentially, we’re populating both the awareness and consideration levels of the client’s lead funnel.
Conclusion
For your website to be successful on search, Google needs to be confident that you’re a true authority in your industry, both from a commercial and informational perspective. Our role is to provide the strategy, targeting, competitor analysis & audience qualification, content management, and develop an efficient rollout plan that brings these results in the shortest possible time frame.


